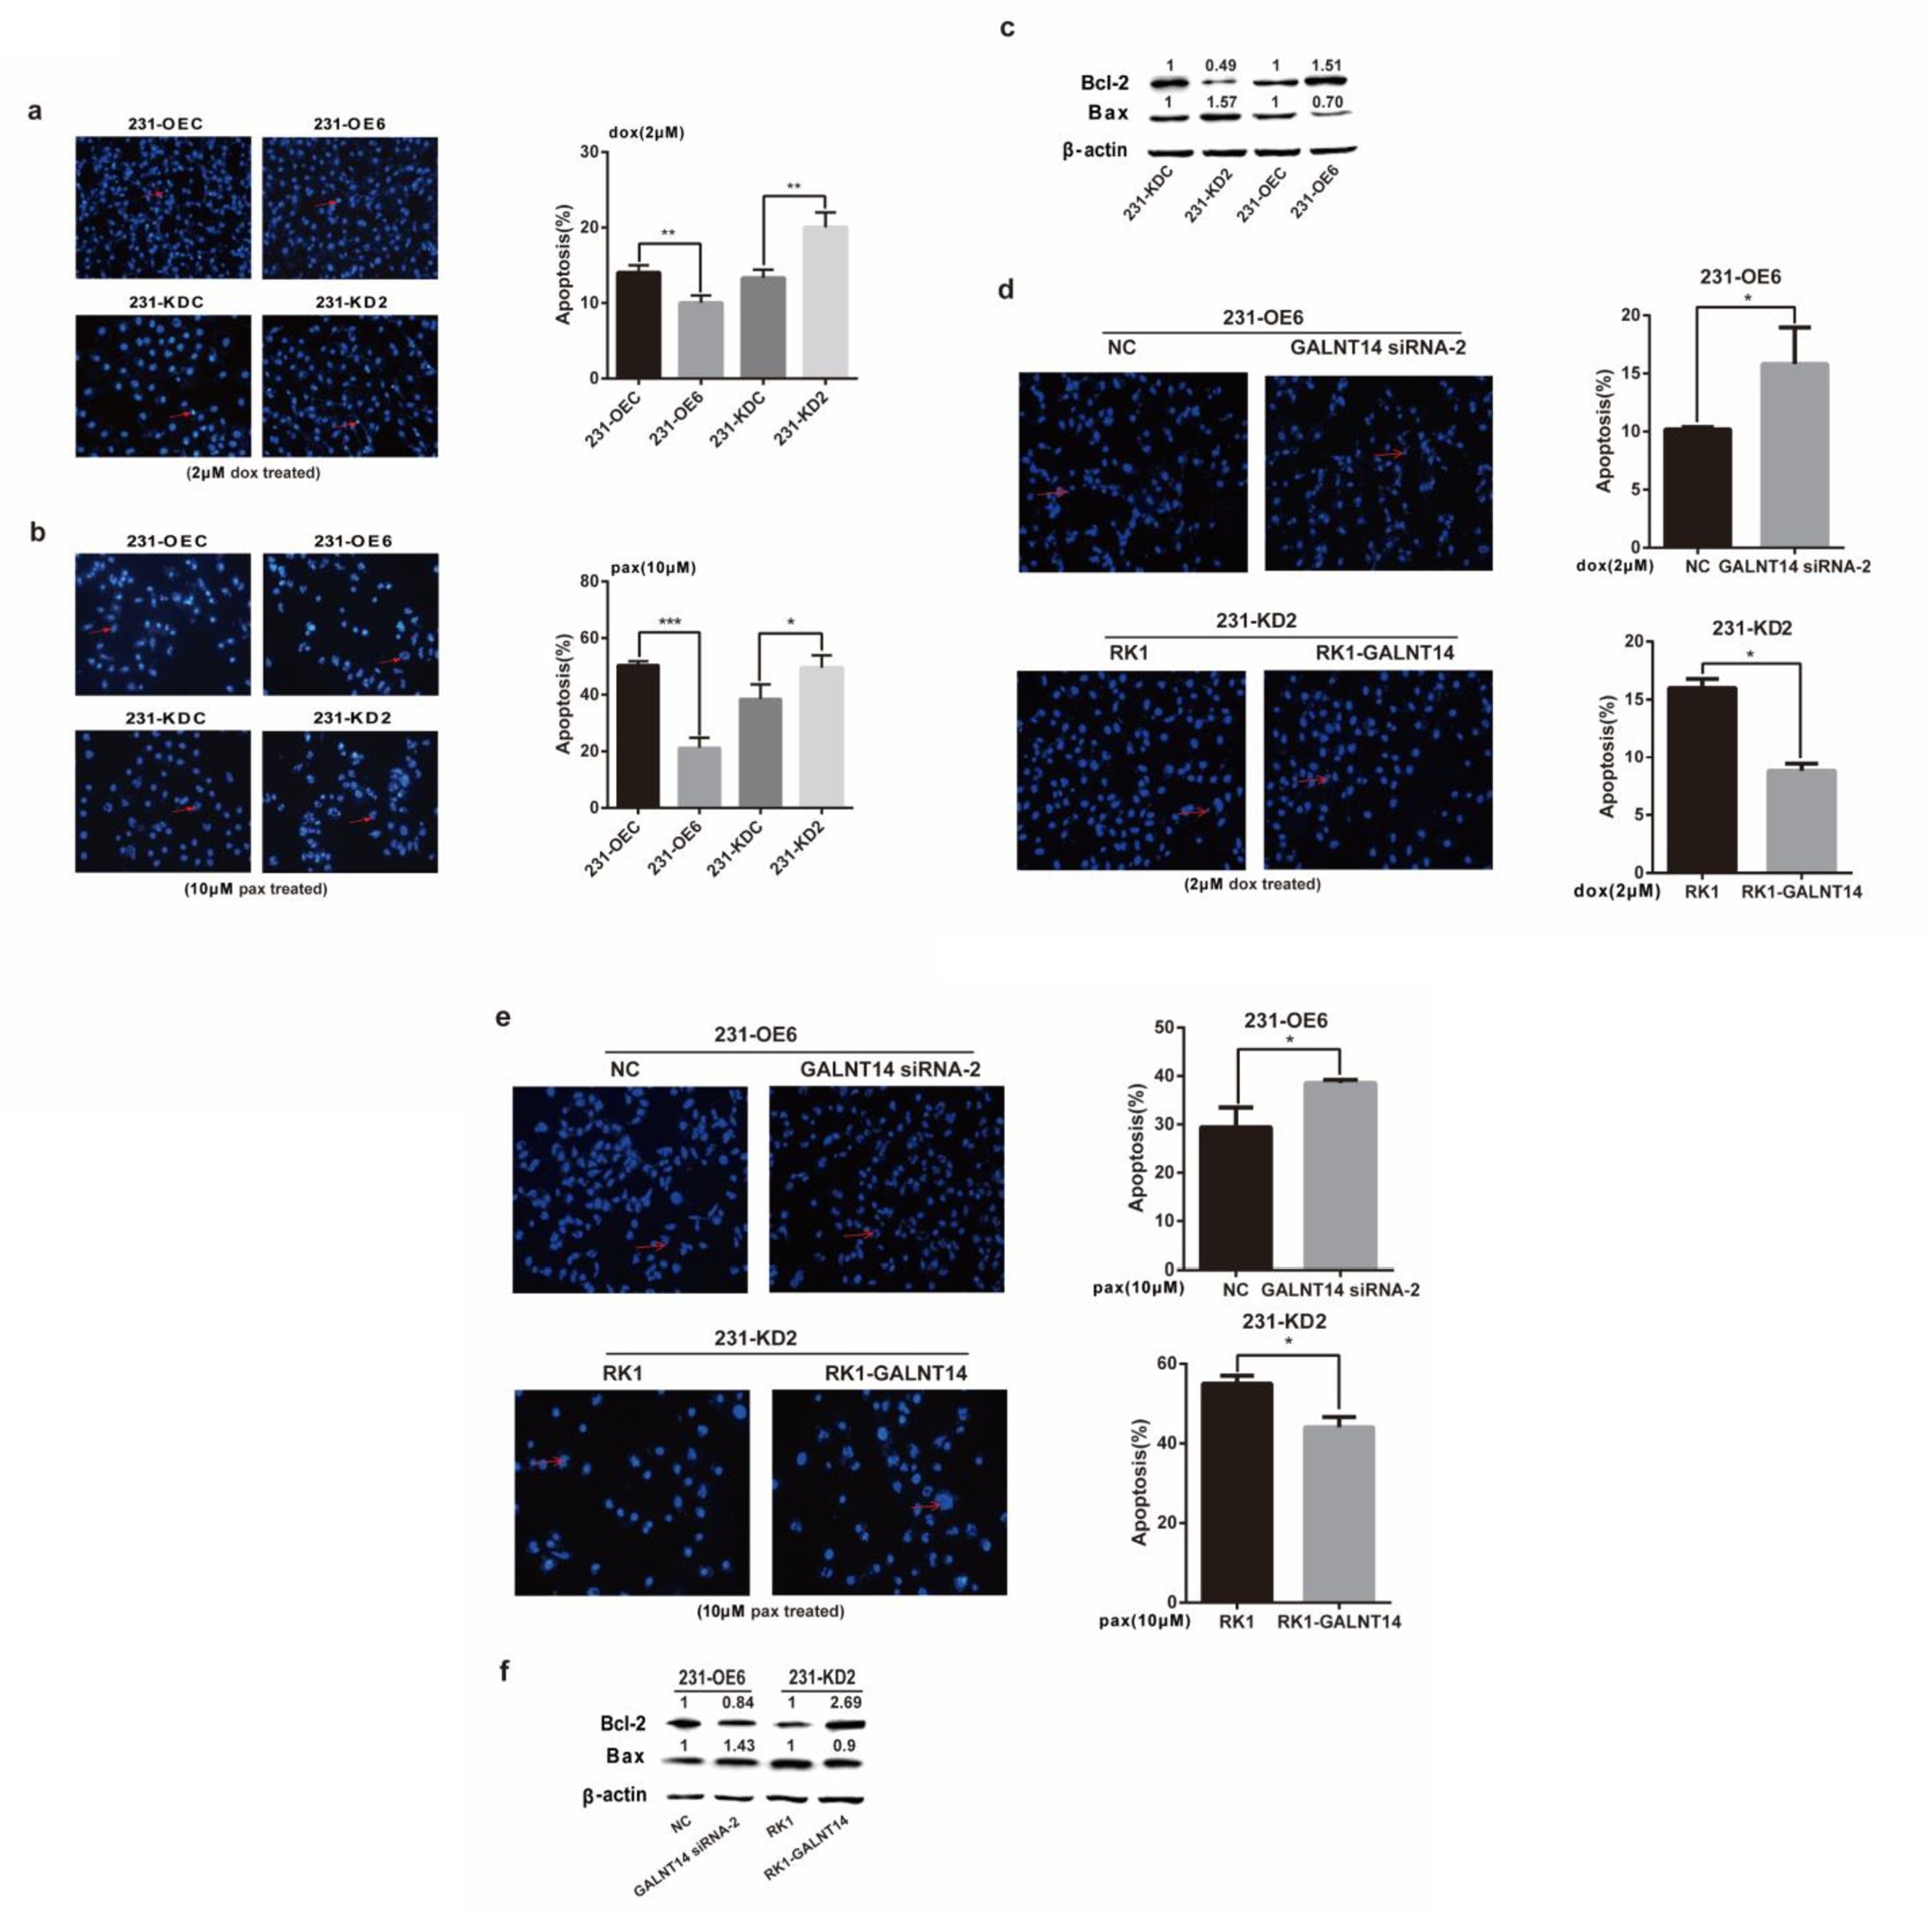
Fig. 4. Osx enhances the anti-apoptosis of breast cancer cells. (a and b) 231-OE6 and 231-KD2 cells, as well as their corresponding control cells, were treated with 2 μM dox or 10 μM pax for 36 h. Apoptotic cells were assayed with Hoechst staining and highlighted by a red arrow (left). Quantification of apoptotic cells is shown in the right panels. (c) Bcl-2 and Bax protein were detected by western blot analysis in 231-OE6 and 231-KD2 cells, as well as in their corresponding control cells. β-Actin served as an internal control. The 26-kDa blot of Bcl-2, 21-kDa blot of Bax and 42-kDa blot of β-actin were cropped from the same gel and were run under the same experimental conditions. The fold change of KD or OE vs. control was calculated after quantification and was presented above each blot. (d and e) GALNT14 siRNA-2 and NC were transiently transfected into 231-OE6 cells. The RK1-GALNT14 expression plasmid and RK1 were transiently transfected into 231-KD2 cells. Next, the transfected cells were treated with 2 μM dox or 10 μM pax for 36 h. Apoptotic cells were assayed by Hoechst staining and highlighted by a red arrow (left). Quantification of apoptotic cells are shown in right panels. The results are the means ± SD of three independent experiments. * p<0.05, ** p<0.01. (f) Bcl-2 and Bax protein were detected by western blot analysis in 231-OE6 cells transfected with GALNT14 siRNA-2 or NC, as well as in 231-KD2 cells transfected with the RK1-GALNT14 expression plasmid or RK1 vector. β-Actin served as an internal control. The 26-kDa blot of Bcl-2, 21-kDa blot of Bax and 42-kDa blot of β-actin were cropped from the same gel and run under the same experimental conditions. The fold change of KD or OE vs. control was calculated after quantification and are presented above each blot.